Wireless sensors provide an excellent view of applications such as monitoring environmental conditions or industrial plants and machinery. Because they are easy to install, they can be deployed in a variety of environments. In the coming years, with the widespread deployment of the Internet of Things (IoT), the application of wireless sensors will explode. But one of the most important factors limiting wireless sensor applications is their limited endurance. When the wireless sensor's operation is completely dependent on the battery, once the battery runs out of power, the sensor becomes a waste product.
If you're designing a battery-powered wireless sensor, you need to solve a myriad of problems to make sure it works for a certain amount of time. The usual method is to use electricity only when the necessary activities are performed. At other times, the sensor will enter the low power usage mode. The work of wireless sensors can be divided into a series of activities, each of which consumes a certain amount of energy over a period of time. The most common activities include:
â— wake up, measure, and process data into information
â— Power on the RF power amplifier, send information, and power off the RF power amplifier again.
â— In two-way sensors (send and receive): wake up, power up the receiver, receive signals, process data, act according to information, and power down again
Obviously, there are many operations that consume battery power.
The easiest way to extend battery life is to use a larger battery with a larger capacity battery. However, your customers may want sensors that are small and capable (so they can send large amounts of data and have intelligent/data processing capabilities locally). Obviously, the customer's expectations are completely contrary to the easiest way to solve the problem of short battery life.

Figure 1: Current levels of wireless sensors in three main states.
How do engineers estimate the battery's power supply time? ?
As a design engineer, you need to think globally to find the balance between battery size and wireless sensor functionality so that small batteries can perform at their best and last long enough. The optimization process first needs to understand the energy requirements. Collecting data on energy usage is the first step in characterizing device performance.
The battery has a predefined amount of energy (Wh) and capacity (Ah). If you know how much power the device needs to work, you can calculate the battery's power-on time.
Battery life (hours) = battery capacity (Wh) / average discharge power (W)
The energy of the battery is also the product of its rated voltage (V) and capacity (Ah). The rated voltage is the midpoint of the battery discharge curve determined by experience and can correctly correlate the energy and capacity of the battery. Based on this definition, the battery's power supply time can also be determined using this formula:
Battery life (hours) = battery capacity (Ah) / average discharge current (A)

Figure 2: The Keysight N6781A SMU is capable of accurate measurements across dynamic current levels.
However, when the device is actually working, the battery life is usually shorter than the result of your calculation. The most common opinion we have heard is: "The quality of this battery is too bad!" Some big battery brands usually provide detailed technical specifications and explain that between the same type of battery, the capacity will usually be 5%. 10% difference. But even with conservatively estimated battery capacity, battery power times often fall short of standards. The length of time the device has been working is shorter than we expected. Why is this happening? Is our estimated battery usage correct? May be incorrect. Let us explore this issue.
Measuring the complexity of dynamic current consumption?
In battery-powered devices such as wireless sensors, to save power, the sub-circuits of the device are only activated when needed. Engineers designed the device to be in a sleep mode that consumes the least amount of power most of the time. In sleep mode, only the real time clock is running. The device wakes up periodically to perform measurements. The collected data is then sent to the receiving node.
Different operating modes result in current consumption spanning a wide dynamic range from sub-uA to 100 mA with a ratio of 1:1,000,000.
Traditional measurement techniques and their limitations?
To measure current, a well-known method is to use the multimeter's ammeter function. Using modern digital multimeters seems to give good current measurement accuracy, but its specifications are based on a fixed range and relatively static signal levels. Because of the dynamic current consumption of wireless sensors, it is not very suitable for using a multimeter. measuring.

Figure 3: Data logger: All samples are unified into a continuous sampling period. No sample is lost. Minimum and maximum values ​​are also available for each sample period.
The digital multimeter is connected in series between the battery and the device to measure the current. Due to the sensor's activation period or transmission mode, we will see unstable readings from time to time. We know that digital multimeters have multiple ranges, and autoranging allows you to choose the most appropriate range and provide the best accuracy. However, digital multimeters are not all advantages. Autoranging takes time to change range and stabilize measurement results. The autoranging time is usually 10ms to 100ms, which is longer than the transmission or activation mode. Therefore, the user needs to disable the auto range function and manually select the most appropriate range.
The principle of measuring a digital multimeter is by inserting a splitter into the circuit and then measuring the voltage drop across the splitter. Typically, to measure small currents, you can use a high-resistance splitter and select a low range; to measure large currents, use a low-resistance splitter and select a high range. This voltage drop is also referred to as the load voltage. Due to this voltage drop, not all battery voltages can reach the wireless sensor. The low range is the most accurate and can measure sleep current, but it will withstand a certain voltage during peak currents, and this may even cause a device reset. In fact, we ended up making a compromise, using a large current range to ensure that the device will work properly at peak currents. This compromise allows us to handle peak currents as well as sleep currents, but at the cost of it. Since the offset error is specified based on the full scale of the range, it can seriously affect the measurement of low current levels. This error may be 0.005% of the 100mA range, which is 5μA, but 50% for 10μA and 500% for 1μA. The device is at this current level most of the time, so this error has a huge impact on the estimation of battery life.
After measuring the low current level of the sensor in sleep mode, we must also measure the activation pulse and the transmission pulse, including the current level, and the time the sensor is at that level. An oscilloscope is an excellent tool for measuring signal over time. However, we need to measure the level current of several tens of mA. The current probe is not suitable for this task due to limited sensitivity and drift. Good clamp probes have 2.5mArms of noise and often require repeated zero compensation procedures. The current probe measures the electric field of the line, so the secret to increasing sensitivity is to pass the same line multiple times, increasing the magnetic field several times - and thus the current reading is increased several times, allowing us to measure the current better. In this way, we can capture current pulses for activation time and transmission time. Even during the activation and transmission time, the current changes level: it is like a series of bursts consisting of high and low levels. In order to calculate the average current correctly, this waveform needs to be derived and all measurement points need to be integrated to obtain an average value.
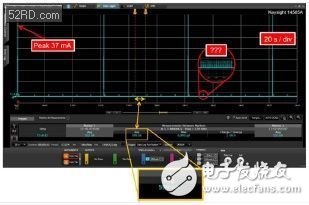
Figure 4: The current consumption record for more than 200 seconds of operation provides a new perspective for observing the device's dynamic current consumption.
The oscilloscope is a good capture of a single burst. However, if you want to verify how many times the sensor has been activated for a period of time, how often it takes to send a TX burst, the measurement will be more complicated. The oscilloscope makes measurements easy and excellent in a short amount of time, but the sensor has a few minutes or hours of operation, making it more complicated to capture and measure.
Measuring innovation?
The Keysight N6781A Power/Measure Unit (SMU) for battery power analysis overcomes the limitations of traditional measurement methods through two innovations: seamless current range and long-term, uninterrupted data logging. This SMU module can be used with the Keysight N6700 Small Modular Power System or the N6705 DC Power Analyzer.
The seamless current range is a patented technology that allows the SMU to change the measurement range while the output voltage remains stable and does not cause a voltage drop due to range changes. This feature allows you to measure peaks with a high current range and sleep current with a 1mA FS range with a 100nA offset error. This low offset error (10nA offset error is 10% for 1μA and 1% for 10μA) is orders of magnitude better than traditional digital multimeters.
The seamless current range, combined with two digitizers, measures voltage and current at a simultaneous sampling rate of 200kSa/s (5us time resolution). With full-time resolution, digital measurements can be captured and displayed for more than 2 seconds. The lower the resolution, the more proportional time increases. However, for long-term measurements, the Keysight N6705B Modular DC Power Analyzer's built-in data logger integrates 200kSa/s measurements over a user-defined integration period (20us to 60 seconds) without losing the integration period. Any sample.
Since the data logger is uninterval, all samples are classified into one integration period or the next integration period - no samples are lost. With data loggers, engineers can now measure the current and energy consumption of wireless sensors for up to 1000 hours of operation.
To measure the sleep current, you only need to place the cursor to read the measurement reading directly. Figure 4 shows the measurement results obtained in a single acquisition of a long period; we can obtain a complete current consumption diagram and accurately measure the sleep current to 599 nA.
Through the pan and zoom functions, we are able to see the current level and the hold time of each power level. Details that are not visible with traditional measuring tools can now be viewed at a glance and measured. The trailing edge pulse determined using "???" in Figure 4 is a clear example. The software unveiled this surprising secret: for an average current of 3.3μA, the device consumes pulse energy at a peak of about 90μA for a duration of 500ms. Adding this current consumption to the 599nA sleep current results in 730nA, which is 22% higher than our expected current. This kind of accident may be one of the reasons why we underestimated the energy requirements and made the battery power supply time shorter than expected.
Knowing these details is very helpful for engineers when optimizing wireless sensor power consumption. When pursuing a balance between user experience and battery consumption, and answering questions such as "Would I send information every second, every 5 seconds, or every 10 seconds?", it is important to know how much energy is needed to send a packet. Engineers can accurately estimate the impact of battery consumption on any firmware changes and validate them with actual measurements in a reasonable amount of time.
Easy Joule measurement?
Joule is very useful in estimating battery power time because each activity consumes a certain amount of energy. We can also use Joule/Transmit bits to compare device performance. But engineers rarely use joules because they need to be calculated using voltage, current, and time.
The energy of the Joule unit can be measured directly using the Keysight 14585A control and analysis software. For example, you can measure how much energy is needed to transmit a packet captured in a triggered measurement. This advantage comes from the use of two digitizers to simultaneously sample voltage and current for point-by-point power measurement. Joule can be easily read as a value between cursors, and the designer can even further define Joule/transmit bits.
Ac Linear Actuator,Miniature Linear Actuators,24V Linear Actuator,Mini Linear Actuator
Changzhou Sherry International Trading Co., Ltd. , https://www.sherry-motor.com