Advantages Of An Automated Setup
Abstract: This arTIcle describes an automated data collecTIon system for analog-to-digital converters (ADCs). It discusses the advantages of automaTIng data collecTIon as well as a detailed description of the hardware and software. It goes on to explain the operation of the system and give some data examples.
Background on GPIB Originally developed by Hewlett Packard as HP-IB, GPIB is a high-speed communication interface which allows interconnection and control of programmable instruments. A controller card, which often resides in a PC, controls a wide variety of test instruments such as logic analyzers, signal and data generators, digital voltmeters, and power supplies. GPIB was standardized by the IEEE and is now known by the three names GPIB, HP-IB, and IEEE-488 bus. Further information regarding GPIB can be found on the world wide web at http: // (National Instruments) or http: //GPIB/tutor.htm.
Advantages Of An Automated SetupOne advantage of using an automated test setup is that it speeds up the task of characterizing parts. Ideally, the software should be written and debugged in advance, so that when parts are available, valuable time is not spent writing and debugging software code. For our test setup, Visual C ++ was selected as the programming language.
With a functional automated test setup, some of the more difficult data converter plots such as integral non-linearity (INL), differential non-linearity (DNL), and fast Fourier transform (FFT) plots can be made available within minutes.
Modular software allows re-use for other programs. With flexible code, the software can be easily modified for other converters with different speeds and resolutions.
Another key advantage of an automated setup is that the design engineer doesn't need to know the equipment and instruments intimately since the software automatically programs all of the instrument settings. Although a fundamental knowledge of the equipment is still essential to insure accurate results. While the tests are running, the engineer often does not have to be physically present. Often, the tasks of supervising tests and obtaining data are delegated to a lab technician, thus freeing up the engineer even more.
Setup Requirements GPIB Interface CardThe GPIB interface card plugs into one of the PC expansion slots and allows the PC to communicate with any test instrument that has a GPIB Interface. One GPIB cable is necessary for each instrument. The instruments are interconnected using a serial daisy- chain starting from the PC and ending at the last instrument. Each instrument requires a unique GPIB address. The available addresses are 0 through 31. The number of instruments that can be on the GPIB Bus depends on the length of cables and how they are connected . In practical applications up to 10 instruments have been connected at the same time.
Pattern GeneratorThe pattern generator creates all of the I / O data patterns used to communicate with the device-under-test (DUT). Since, in this example, the ADC has a serial output, the pattern generator is also used to provide the signals that control the timing for the de-serializer board. A de-serializer board allows the logic analyzer memory to be used more efficiently. The serial peripherals interface (SPI) signals (clock, data, and chip-select) are derived from the pattern generator. For the two-wire I²C interface, the clock and data signals are generated. Since the I²C data line is bi-directional, a circuit with open collector buffers is required.
The data patterns are loaded via the GPIB interface. The GPIB interface also controls the setup of the pattern generator.
Logic Analyzer For an ADC, the logic analyzer is used to capture the conversion data and store it in a file. Setup of the logic analyzer is controlled by the GPIB, but due to speed constraints of the GPIB our data file was transferred to the PC through a local area network (LAN).
Signal or Pulse Generators Two signal / pulse generators are necessary. One is used to generate the conversion clock (or sample frequency). The other is used to generate the ADC input signal (or test frequency). The signals from both units should be synchronized . This is called coherent testing. Note that the conversion clock generator drives the pattern generator.
Power Supplies Supply voltages need to provide power to the DUT and the de-serializer board. These supplies can be programmable if desired to further automate the test setup.
DC Power Source A clean DC power source is needed to provide voltage reference for the ADC or DAC. The Datel Calibrator was used in our setup.
De-Serializer Board This circuit is used to convert the serial data output of an ADC to a parallel format, so that the data can be captured by the logic analyzer more efficiently. Although the data could be deserialized by the code, the parallel format makes better use of the logic analyzer memory.
Figure 1 illustrates how the instruments are interconnected to the PC and to each other. For parallel interface ADCs, the de-serializer board is not needed.
Figure 1. Interconnection of equipment for serial or parallel-output ADC.
SoftwareThe software was developed using Visual C ++ and is compatible with Win95 / 98 or Windows NT. The programs were all written in Windows using the GUI interface, making it user-friendly.
One of the key features of the software is the initialization feature called INIT or SETUP (see Figure 3). When the operator clicks on this feature, it sets up the correct patterns in the pattern generator, and sets up the logic analyzer so that it is ready to capture the data. The operator never has to touch the instruments other than to make sure that they are powered up and connected properly.
The software allows the operator to select the converter sample rate and the resolution of the device. It also allows control of the number of samples taken. While the conversions are occurring, the data is written to a file.
There are two programs used, one for control and data acquisition, and the second for analyzing the data. The control and acquisition program controls the data generator and acquires data from the logic analyzer. The analysis software calculates INL, DNL, ​​and FFTs.
Software can also be developed for other tests such as zero-scale error, full-scale error, and gain error. This however requires a software servo loop and is a topic for another application note.
The analysis software is a universal program that can be used to analyze the data for any ADC. Below are example screens of the software.
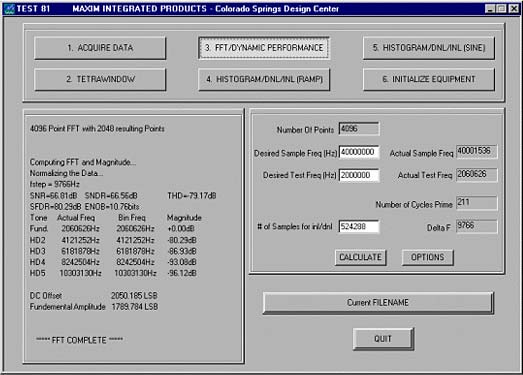
Figure 2. Screen for Test81.
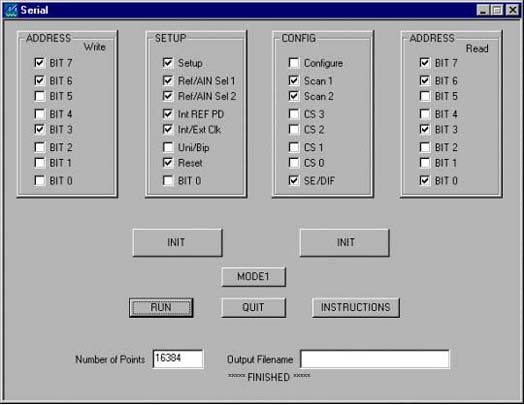
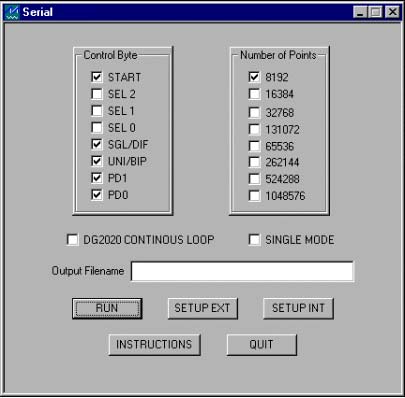
Figure 3. Screens for control.
OperationTo perform an FFT or test for INL or DNL, ​​the test frequency and sample frequency must be properly selected to insure: (1) that all digital codes in the converter are exercised, and (2) that the signal-to-noise and harmonic Distortion measurements are not compromised by the test methodology. Using the prime number approach, a prime number of test-tone cycles is acquired, which results in no discontinuity between the data endpoints. This method produces a spectrally pure result, where the test-tone and harmonics are each contained in one frequency bin. That is, an FFT has discrete frequency bins of finite bandwidth. Properly selected sample and test-tone frequencies result in all the energy from the test-tone appearing in a single frequency bin. It is important that the conversion clock generator and test-tone generator be synchronized for coherent testing.
For example, given a sample frequency fSAMPLE = 100ksps, a test-tone frequency fTEST = 1kHz, and the number of points acquired, N = 4096, we can determine what frequencies should be used. The bandwidth of each frequency bin is given by fSAMPLE /N=24.41. Round this result up this to 25Hz. Now recalculating the sample frequency yields 25 × N = 102.4ksps. To determine the test-tone frequency, start with fTEST / 25 = 40. Choose the closest prime number to 40, which is 41. This yields a recalculated test-tone frequency of 41 × 25 = 1025Hz. Note that fTEST is a rational number and can readily be loaded into most signal generators. An irrational number would cause leakage in the FFT and lead to an erroneous SNR. A single-sided FFT will have 2048 (N / 2) bins. Given that each bin is 25Hz wide the FFT should extend to 51.2kHz, which is exactly fSAMPLE / 2. All the test-tone energy should be in the 41st bin or at 25 × 41 = 1025Hz.
The function generator used for the test frequency should have low distortion. If a low distortion signal generator is not available a filter can be used to reduce harmonics.
Use the following steps to complete the data collection process:
Click the INIT button so that the logic analyzer and pattern generator can be set up. Enter a filename where the conversion data will be stored. If necessary, select the resolution of the converter being tested. This is usually set up to default to the proper value. Select the number of points in the FFT or number of conversions. Click the "RUN" button. At this point the program will set the converter up, begin conversions and capture the desired amount of conversion data. The data will then be saved in the desired file. After the data has been saved, the file can then be loaded into Test81 or any other program that computes the desired information from the raw conversion data.
The FFT results can be plotted showing various harmonics or spurs associated with the measurement. In addition, the dynamic performance numbers are shown in the control window and on the plot. These include the SFDR, SNR, SINAD, THD, and ENOB. Each harmonic (up to the fifth) is denoted along with the frequency and relative level.
The INL and DNL can be computed using a linear ramp signal at the ADC input or using the sine histogram method. The sine histogram method has the advantage of using a clean sinusoid rather than having to generate a highly linear ramp. For applications with AC input signals, the sine histogram method is a better barometer of ADC performance because it provides test data for AC inputs, unlike some converters that are only tested with DC input signals.
To set up the sine histogram INL / DNL tests, run the prime cycle calculation. This insures that all the code bins will be exercised and the overall histogram will have a sinusoidal probability distribution¹. The converter should be slightly overdriven. This will overfill the first and last bins of the histogram, but this data is thrown out. The offset and gain is automatically calculated and the DNL and INL plots are produced.
Below are example plots plotted with Gnuplot.
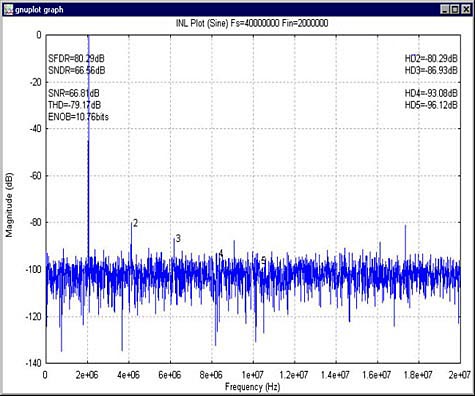
Figure 4. Dynamic performance (FFT) Plot.
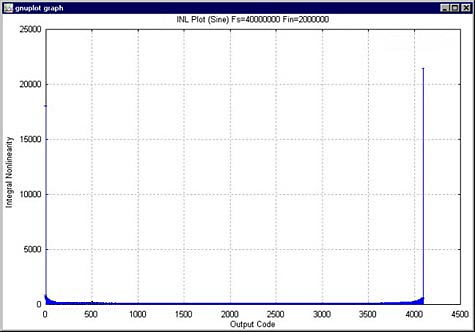
Figure 5. Histogram plot.
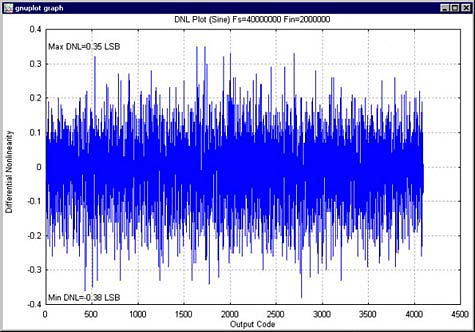
Figure 6. DNL plot.
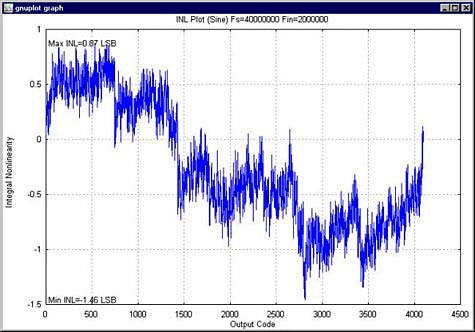
Figure 7. INL plot.
1. J. Doernberg, HS Lee, DA Hodges, "Full-Speed ​​Testing of A / D Converters," IEEE J. Solid-State Circuits, vol. SC-19, no.6, pp. 820-827, Dec. 1984.
Battery Testing Machine,Battery Checking Machine,Battery Tester Machine,Battery Technical Service
Zhijiang BSL battery technology service company , https://www.bslbatteryservice.com